 Web Server Statistics for tb3.com Web Server Statistics for tb3.com
(Go To: Top: General Summary: Daily Summary: Hourly Summary: Domain Report: Organization Report: Operating System Report: Status Code Report: File Size Report: File Type Report: Directory Report: Request Report)
This report contains overall statistics.
Successful requests: 46,151
Average successful requests per day: 46,150
Successful requests for pages: 37,505
Average successful requests for pages per day: 37,504
Failed requests: 1,073
Redirected requests: 21
Distinct files requested: 7,175
Distinct hosts served: 5,463
Corrupt logfile lines: 254
Data transferred: 15.91 gigabytes
Average data transferred per day: 15.91 gigabytes
(Go To: Top: General Summary: Daily Summary: Hourly Summary: Domain Report: Organization Report: Operating System Report: Status Code Report: File Size Report: File Type Report: Directory Report: Request Report)
This report lists the total activity for each day of the week, summed over all the weeks in the report.
Each unit ( ) represents 1,000
requests for pages or part thereof.
) represents 1,000
requests for pages or part thereof.
day: #reqs: #pages: ---: -----: ------: Sun: 0: 0: Mon: 0: 0: Tue: 46141: 37498:Wed: 10: 7:
(Go To: Top: General Summary: Daily Summary: Hourly Summary: Domain Report: Organization Report: Operating System Report: Status Code Report: File Size Report: File Type Report: Directory Report: Request Report)
This report lists the total activity for each hour of the day, summed over all the days in the report.
Each unit () represents 50 requests
for pages or part thereof.
hour: #reqs: #pages: ----: -----: ------: 0: 2041: 1704:4: 1661: 1380:
5: 1851: 1507:
8: 1985: 1673:
(Go To: Top: General Summary: Daily Summary: Hourly Summary: Domain Report: Organization Report: Operating System Report: Status Code Report: File Size Report: File Type Report: Directory Report: Request Report)
This report lists the countries of the computers which requested files.
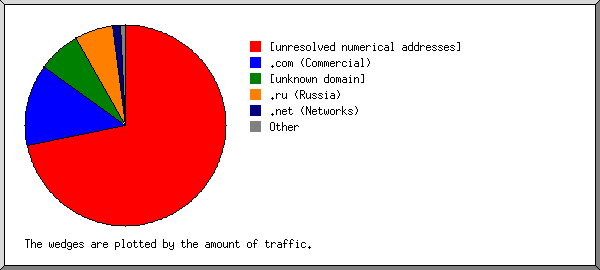
Listing domains, sorted by the amount of traffic.
#reqs: %bytes: domain
-----: ------: ------
31483: 75.04%: [unresolved numerical addresses]
 6024: 19.13%: .ru (Russia)
 2610:  2.07%: .com (Commercial)
 3286:  1.77%: [unknown domain]
 1732:  0.67%: .net (Networks)
  154:  0.30%: .de (Germany)
   56:  0.23%: .np (Nepal)
   87:  0.21%: .br (Brazil)
  192:  0.18%: .vn (Vietnam)
   29:  0.10%: [domain not given]
   11:  0.05%: .in (India)
    9:  0.04%: .it (Italy)
   64:  0.03%: .ua (Ukraine)
   10:  0.03%: .bo (Bolivia)
   11:  0.02%: .arpa (Arpanet)
    4:  0.02%: .pl (Poland)
    4:  0.02%: .id (Indonesia)
   25:  0.02%: .cn (China)
    3:  0.01%: .my (Malaysia)
   17:  0.01%: .nl (Netherlands)
   95:  0.01%: .il (Israel)
   23:  0.01%: .no (Norway)
   38:  0.01%: .ar (Argentina)
   12:       : .ca (Canada)
    6:       : .ae (United Arab Emirates)
    3:       : .kg (Kyrgyzstan)
    2:       : .fr (France)
   11:       : .cz (Czech Republic)
    2:       : .ve (Venezuela)
    1:       : .md (Moldova)
   23:       : .co (Colombia)
    1:       : .hu (Hungary)
    8:       : .org (Non Profit Making Organizations)
    1:       : .ch (Switzerland)
   24:       : .mx (Mexico)
   12:       : .ec (Ecuador)
    1:       : .es (Spain)
    8:       : .za (South Africa)
   10:       : .uz (Uzbekistan)
    2:       : .ao (Angola)
    2:       : .cr (Costa Rica)
    1:       : .bd (Bangladesh)
   15:       : .cl (Chile)
    4:       : .lt (Lithuania)
    1:       : .jp (Japan)
    6:       : .pk (Pakistan)
    2:       : .ni (Nicaragua)
    3:       : .uy (Uruguay)
    2:       : .py (Paraguay)
    2:       : .hr (Croatia)
    2:       : .gt (Guatemala)
    2:       : .cc (Cocos (Keeling) Islands)
    1:       : .at (Austria)
    1:       : .ke (Kenya)
    1:       : .tr (Turkey)
    1:       : .om (Oman)
    1:       : .bg (Bulgaria)
    1:       : .lv (Latvia)
    1:       : .sv (El Salvador)
    1:       : .jo (Jordan)
    1:       : .uk (United Kingdom)
    1:       : .gy (Guyana)
    1:       : .ps (Occupied Palestinian Territory)
    1:       : .pe (Peru)
    1:       : .do (Dominican Republic)
    2:       : .kz (Kazakhstan)
(Go To: Top: General Summary: Daily Summary: Hourly Summary: Domain Report: Organization Report: Operating System Report: Status Code Report: File Size Report: File Type Report: Directory Report: Request Report)
This report lists the organizations of the computers which requested files.
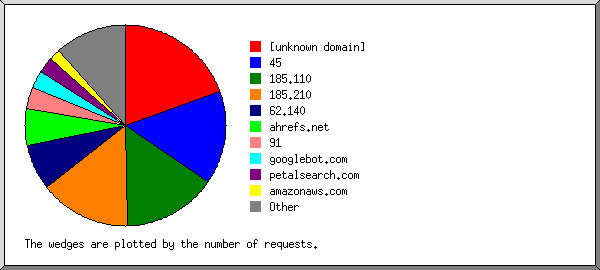
Listing the top 20 organizations by the number of requests, sorted by the number of requests.
#reqs: %bytes: organization
-----: ------: ------------
17313: 67.31%: 144.124
 6702:  2.25%: 5
 5894: 19.06%: serverhub.ru
 3286:  1.77%: [unknown domain]
 2562:  0.16%: 45
  800:       : ahrefs.net
  795:  0.35%: 216.73
  498:  0.60%: datapacket.com
  404:  0.02%: bytedance.com
  369:  0.14%: petalsearch.com
  356:  0.11%: ovh.net
  343:  0.36%: googleusercontent.com
  335:  0.71%: 89
  192:  0.18%: vn
  191:  0.06%: 43
  165:  0.07%: baidu.com
  163:  0.09%: amazonaws.com
  153:  0.57%: 185.39
  146:  0.23%: 47
  110:  0.02%: 143.14
 5374:  5.92%: [not listed: 788 organizations]
(Go To: Top: General Summary: Daily Summary: Hourly Summary: Domain Report: Organization Report: Operating System Report: Status Code Report: File Size Report: File Type Report: Directory Report: Request Report)
This report lists the operating systems used by visitors.
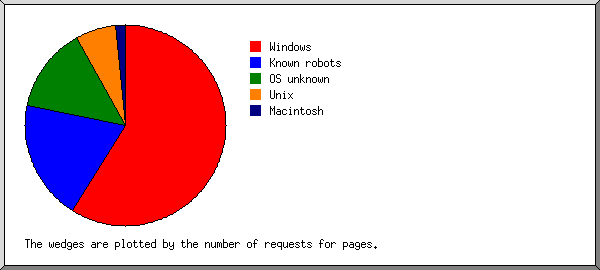
Listing operating systems, sorted by the number of requests for pages.
 #: #reqs: #pages: OS
--: -----: ------: --
 1: 35977:  31236: Windows
  : 32904:  28182:   Windows NT
  :  3047:   3035:   Unknown Windows
  :    19:     13:   Windows XP
  :     3:      3:   Windows 2000
  :     2:      2:   Windows 95
  :     1:      1:   Windows CE
  :     1:      0:   Windows 98
 2:  5126:   3217: OS unknown
 3:  1615:   1314: Macintosh
 4:  1734:    969: Known robots
 5:  1248:    763: Unix
  :  1236:    751:   Linux
  :     9:      9:   Other Unix
  :     3:      3:   BSD
(Go To: Top: General Summary: Daily Summary: Hourly Summary: Domain Report: Organization Report: Operating System Report: Status Code Report: File Size Report: File Type Report: Directory Report: Request Report)
This report lists the HTTP status codes of all requests.
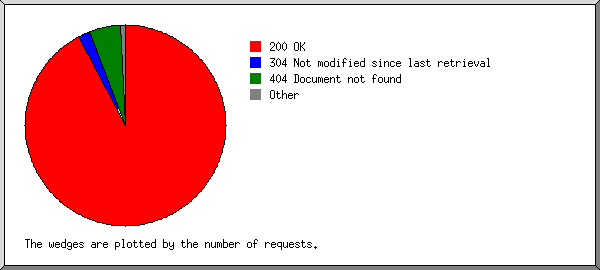
Listing status codes, sorted numerically.
#reqs: status code
-----: -----------
42521: 200 OK
 2800: 206 Partial content
   21: 301 Document moved permanently
  830: 304 Not modified since last retrieval
 1072: 404 Document not found
    1: 405 Method not allowed
(Go To: Top: General Summary: Daily Summary: Hourly Summary: Domain Report: Organization Report: Operating System Report: Status Code Report: File Size Report: File Type Report: Directory Report: Request Report)
This report lists the sizes of files.
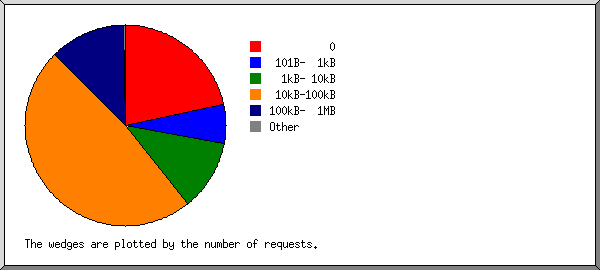
       size: #reqs: %bytes:
-----------: -----: ------:
          0:  3338:       :
   1B-  10B:     2:       :
  11B- 100B:    10:       :
 101B-  1kB:  1846:  0.01%:
  1kB- 10kB:  8904:  0.15%:
 10kB-100kB:  9651:  2.61%:
100kB-  1MB: 22358: 96.04%:
  1MB- 10MB:    37:  0.64%:
 10MB-100MB:     5:  0.55%:
(Go To: Top: General Summary: Daily Summary: Hourly Summary: Domain Report: Organization Report: Operating System Report: Status Code Report: File Size Report: File Type Report: Directory Report: Request Report)
This report lists the extensions of files.
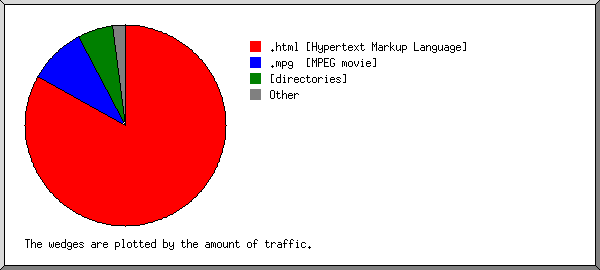
Listing extensions with at least 0.1% of the traffic, sorted by the amount of traffic.
#reqs: %bytes: extension
-----: ------: ---------
30584: 97.79%: .html [Hypertext Markup Language]
 4122:  0.81%: .jpg  [JPEG graphics]
   43:  0.35%: .mpg  [MPEG movie]
    3:  0.31%: .mp4
   17:  0.15%: .pdf  [Adobe Portable Document Format]
  333:  0.10%: .gif  [GIF graphics]
11049:  0.50%: [not listed: 20 extensions]
(Go To: Top: General Summary: Daily Summary: Hourly Summary: Domain Report: Organization Report: Operating System Report: Status Code Report: File Size Report: File Type Report: Directory Report: Request Report)
This report lists the directories from which files were requested. (The figures for each directory include all of its subdirectories.)
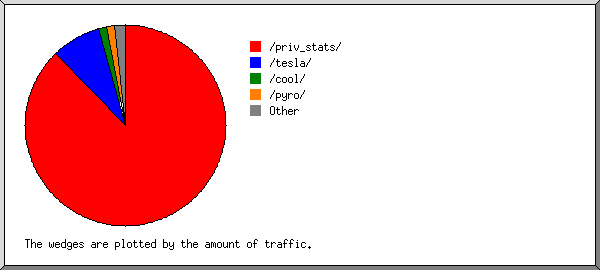
Listing directories with at least 0.01% of the traffic, sorted by the amount of traffic.
#reqs: %bytes: directory
-----: ------: ---------
29182: 97.61%: /priv_stats/
 6622:  1.62%: /tesla/
  934:  0.30%: http://
 4649:  0.13%: /jlwedding/
  390:  0.11%: /gc/
    3:  0.06%: /ces08/
   59:  0.05%: /pyro/
 2899:  0.03%: [root directory]
   84:  0.02%: /stats/
   51:  0.02%: /rafting/
  242:  0.01%: /racetrack/
 1036:  0.04%: [not listed: 21 directories]
(Go To: Top: General Summary: Daily Summary: Hourly Summary: Domain Report: Organization Report: Operating System Report: Status Code Report: File Size Report: File Type Report: Directory Report: Request Report)
This report lists the files on the site.
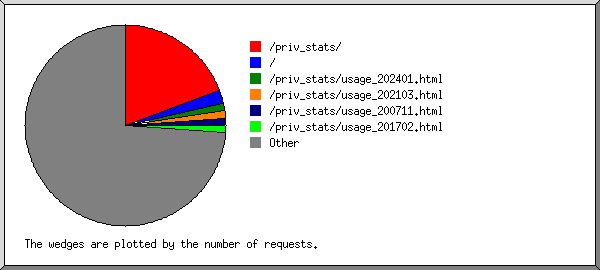
Listing files with at least 20 requests, sorted by the number of requests.
#reqs: %bytes:          last time: file
-----: ------: ------------------: ----
20392: 89.72%: Jun/10/26 12:00 AM: /priv_stats/usage_202605.html
 6649:  2.07%: Jun/ 9/26 11:59 PM: /priv_stats/usage_202512.html
 2789:  0.02%: Jun/ 9/26 11:53 PM: /
 1805:  0.03%: Jun/10/26 12:00 AM: /jlwedding/reception2/res/js/keyboard.js
 1805:  0.03%: Jun/10/26 12:00 AM: /jlwedding/shower2/res/js/keyboard.js
  379:  0.02%: Jun/ 9/26 11:17 PM: /priv_stats/
  256:  1.07%: Jun/ 9/26 11:44 PM: /priv_stats/usage_202606.html
  142:       : Jun/ 9/26 11:32 PM: /cgi-bin/vhcount.pl
   29:       : Jun/ 9/26  9:15 PM:   /cgi-bin/vhcount.pl?index.html
  120:  0.34%: Jun/ 9/26 11:44 PM: /priv_stats/usage_202206.html
  115:  0.47%: Jun/ 9/26  5:32 PM: /priv_stats/usage_202303.html
  104:  0.41%: Jun/ 9/26 11:33 PM: /priv_stats/usage_202408.html
   96:  0.41%: Jun/ 9/26 11:47 PM: /priv_stats/usage_201409.html
   57:  0.24%: Jun/ 9/26  9:55 AM: /priv_stats/usage_202302.html
   44:  0.07%: Jun/ 9/26 11:14 PM: /priv_stats/usage_202105.html
   41:  0.17%: Jun/ 9/26 11:33 PM: /priv_stats/usage_201604.html
   38:  0.15%: Jun/ 9/26 11:33 PM: /priv_stats/usage_202410.html
   34:  0.12%: Jun/ 9/26 11:40 PM: /priv_stats/usage_202201.html
   32:  0.08%: Jun/ 9/26 11:04 PM: /priv_stats/usage_202107.html
   32:  0.05%: Jun/ 9/26 11:12 PM: /priv_stats/usage_202210.html
   30:  0.12%: Jun/ 9/26  9:48 PM: /priv_stats/usage_202305.html
   28:  0.12%: Jun/ 9/26 11:32 PM: /priv_stats/usage_201102.html
   28:  0.07%: Jun/ 9/26 11:06 PM: /priv_stats/usage_202007.html
   26:  0.10%: Jun/ 9/26  6:48 PM: /priv_stats/usage_202312.html
   24:  0.08%: Jun/ 9/26 10:47 PM: /priv_stats/usage_202108.html
   23:  0.10%: Jun/ 9/26 11:05 PM: /priv_stats/usage_202212.html
   22:       : Jun/ 9/26 11:02 PM: /favicon.ico
   21:  0.09%: Jun/ 9/26 11:03 PM: /priv_stats/usage_202501.html
   21:  0.08%: Jun/ 9/26 10:03 AM: /priv_stats/usage_202404.html
10998:  3.76%: Jun/10/26 12:00 AM: [not listed: 6,866 files]
(Go To: Top: General Summary: Daily Summary: Hourly Summary: Domain Report: Organization Report: Operating System Report: Status Code Report: File Size Report: File Type Report: Directory Report: Request Report)

